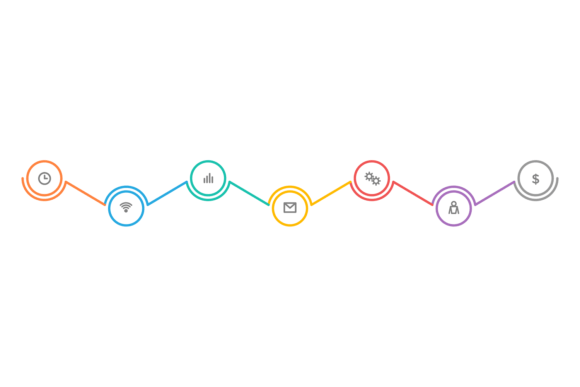
Your Business Timeline Story, Visualized
The visual summary of your company's journey is powerful. Whether it's for an investor pitch deck, an annual report, or your company website, a well-crafted timeline graphic communicates growth, milestones, and credibility efficiently. This is where a specialized asset like Infographic Icons in Business Timeline C becomes a valuable tool. It’s a curated set of icons designed to represent common business events—funding rounds, product launches, team expansions, and partnership deals—within a clean, cohesive timeline framework. For professionals, creators, and entrepreneurs, it promises a shortcut to a polished, professional visual.
However, the path from downloading a file to achieving that polished result is where many stumble. The common assumption is that buying or downloading a pack like this solves the design problem instantly. In reality, it's just the beginning. Let's navigate the common pitfalls and ensure your timeline tells the story you intend, clearly and effectively.
Choosing Format: Beyond the First Download Link
You see the listing: EPS, JPG, SVG, transparent PNG. A beginner might instinctively grab the JPG because it's familiar. This is a critical first mistake. A JPG is a raster format; it has a fixed resolution and cannot be scaled up without losing quality or becoming pixelated. If you need to use your timeline in a large conference banner or a detailed PDF report, the JPG will fail. Similarly, the EPS file is a legacy vector format that some modern design software struggles to edit smoothly.
The practical correction: Always prioritize the SVG (Scalable Vector Graphics) file. SVG is a modern web-standard vector format. It scales infinitely without quality loss, is typically easy to edit in tools like Figma, Adobe Illustrator, or even free online editors, and is perfect for both digital and print applications. The transparent PNG is useful as a quick-use asset for non-designers in PowerPoint or Google Slides, but treat it as a secondary, situational choice. Your primary download should be SVG.
Application Without Adaptation
The pack is labeled "Business Timeline C," implying a specific style or sequence. A common oversight is to use the icons and structure exactly as presented in the preview image. This often results in a generic-looking graphic that doesn’t reflect your unique narrative. Perhaps your company's first milestone was a key patent, not a funding event, but the pack emphasizes financial icons. Using a pre-set icon for "Launch" that doesn't match your product's tone can create a subtle disconnect.
The better approach: Treat these assets as a vocabulary, not a finished sentence. Deconstruct the pack. Use the line and node elements from the timeline for structure, but select only the icons that truly represent your events. Supplement them if needed. Recolor the thin line to match your brand palette. Change the hierarchy. The goal is to adapt the professional foundation to tell your specific story, not to replicate the demo.
The Color and Context Mistake
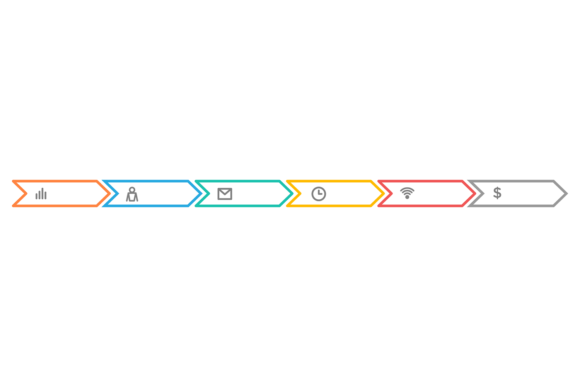
The "color thin line" description is appealing—it suggests simplicity. Yet, placing a brightly colored, thin-line timeline on a complex background can render it invisible. Conversely, using the default colors (often a standard palette) on your branded material can clash, making the timeline feel imported and disjointed from the rest of your presentation.
How this affects results: It undermines visual cohesion and can confuse the viewer about what information is most important. The timeline should integrate seamlessly.
Practical advice: Before applying, test the colors. If you're using it on a white background (as the isolation suggests), ensure the line color has sufficient contrast. If integrating into a branded deck, recolor the entire graphic to use your company's primary and secondary colors. This simple step of customization elevates the asset from a stock graphic to an integral part of your communication.
Overlooking the Narrative Flow
A timeline is not just a list of dates; it’s a story of progress. A technical mistake people make is cramming in every minor event, creating a cluttered, overwhelming chart. The isolated, clean aesthetic of the thin-line chart is lost. Another misunderstanding is placing events purely chronologically without grouping them into thematic phases (e.g., "Foundation," "Growth," "Scale").
What to check before using: Audit your milestones. Which five to seven events are truly pivotal for the audience you're addressing? For investors, funding and key hires matter. For customers, product releases and major updates are key. Select and highlight only those. Use the icons from Infographic Icons in Business Timeline C to represent these themes, and consider using the line breaks or node sizes inherent in the design to visually group phases. Let the visual breathing room of the thin-line design work for you by focusing on clarity.
File Management and Future Use
Many users download the pack, use it once for a project, and forget about the files. Later, when needing to update the timeline for a new milestone, they struggle to find the original editable files or can't remember how they modified them. This leads to recreating work or ending up with inconsistent versions across different company materials.
A constructive solution: Upon download, immediately organize your design assets. Save the original SVG in a designated "Brand Assets/Graphics" folder. When you create your adapted version—say, "2024_Company_Timeline.svg"—save it alongside. Note the color codes and font used in a simple text file. This small habit ensures that updating your timeline next year when you secure that Series B funding is a ten-minute task, not a half-day redesign project. It turns a one-time purchase into a lasting, scalable resource.
Ultimately, assets like Infographic Icons in Business Timeline C are tremendously helpful. They provide a professional baseline that eliminates the need to draw icons from scratch or structure a timeline grid. The key to unlocking their value lies in informed selection, thoughtful adaptation, and strategic application. By avoiding the pitfalls of format missteps, generic application, and poor narrative structure, you transform a stock graphic into a compelling, custom visual that authentically showcases your business journey. Remember, the timeline is about your story; the icons are just the elegant, visual punctuation.