Modern Infographic Elements: Visual Tools for a Data-Driven World
In a world overflowing with data, from social media statistics to complex business analytics, clear communication is paramount. The challenge is no longer just having information, but presenting it in a way that is instantly understandable, memorable, and engaging. This is where modern infographic element design comes into play. These are no longer the rigid, clip-art style graphics of the past. Today's infographic elements are sleek, versatile, and powerful design vectors that serve as the building blocks for visual storytelling across digital and physical media.
What Exactly Are Modern Infographic Element Design Vectors?
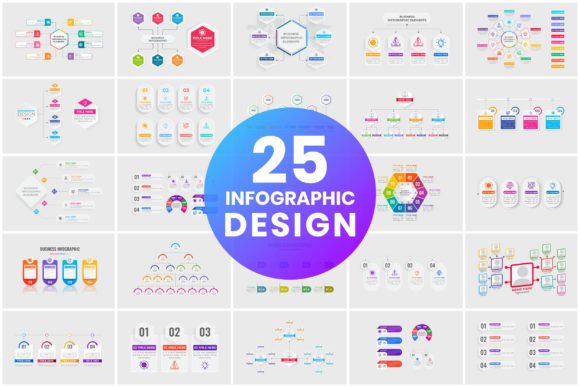
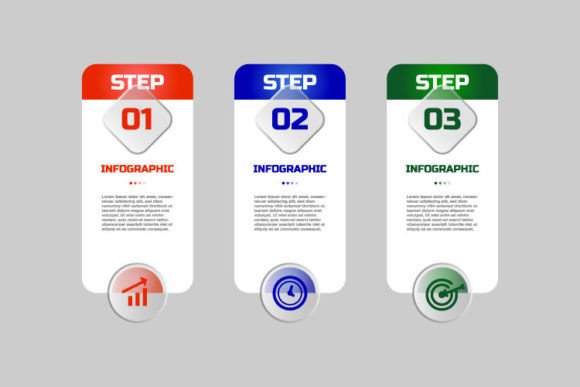
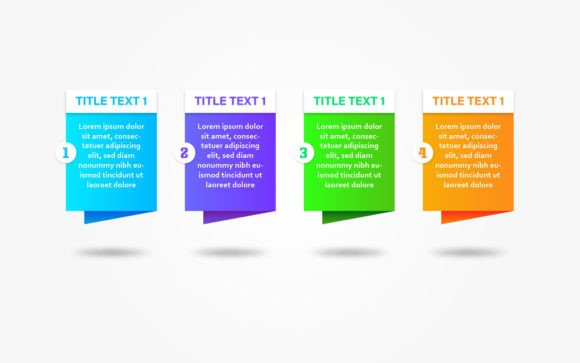
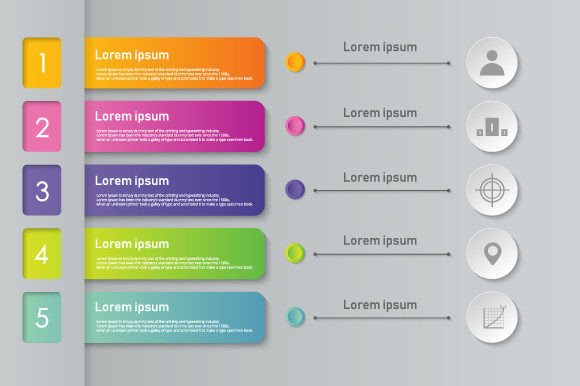
Let's start from the ground up. An infographic is a visual representation of information or data. The "elements" are the individual components used to construct that representation. Think of icons, charts, pictograms, arrows, banners, and background patterns. The term modern infographic element design refers specifically to the contemporary style of these components: clean lines, minimalist aesthetics, cohesive color palettes, and often a flat or semi-flat design approach that eschews excessive detail for clarity.
When these designs are created as vectors, it means they are built using mathematical paths and points rather than pixels. This is a crucial distinction. Vector graphics, saved in file formats like AI (Adobe Illustrator), EPS, and SVG, are infinitely scalable. You can resize them from a tiny icon on a mobile app to a massive backdrop for a trade show banner without any loss of quality or resolution. The accompanying PNG and JPG files provide rasterized versions for specific use cases where pixel-based images are standard, ensuring you have the right file for every need.
A common misunderstanding is that infographic elements are just for creating full, traditional infographics. Their utility is far broader. They are visual shorthand, a toolkit for designers, marketers, educators, and business professionals to enhance any project that requires clarity and visual appeal.
The Core Purpose and Significance
The primary purpose of these design assets is to facilitate understanding. Humans are visual creatures; we process images faster than text. A well-designed chart element can replace a paragraph of numbers. A clever icon can convey a concept more effectively than a label. Their significance lies in their ability to:
- Simplify Complexity: Break down intricate data or processes into digestible visual chunks.
- Increase Engagement: Visual content is more likely to be viewed, shared, and remembered than text-only material.
- Establish Brand Consistency: Using a cohesive set of custom or curated elements across presentations, reports, and websites reinforces professional identity.
- Save Time and Resources: A high-quality vector template provides ready-made, professionally designed components, freeing creators from building every icon from scratch.
Practical Relevance Across Modern Life and Work
Modern infographic elements are not confined to a niche design field. They have permeated almost every aspect of professional and creative communication.
In Business and Marketing
Consider a startup pitching to investors. A slide deck using modern vector elements to illustrate market growth, user demographics, and financial projections is far more compelling than bullet points. Marketing reports use these elements to highlight campaign performance. Even internal documents, like process flowcharts or organizational updates, benefit from visual elements to improve employee comprehension and retention.
In Education and Training
Educational materials have been transformed. Teachers and instructional designers use infographic elements to create engaging worksheets, interactive digital lessons, and study guides. A timeline of historical events built with vector icons, or a diagram of a scientific process using clean, labeled graphics, makes learning more accessible for students of all levels.
In Technology and Digital Products
User interface (UI) and user experience (UX) design heavily rely on these principles. The icons in your smartphone apps, the dashboard charts in your analytics software, and the onboarding tutorials for new web services are all applications of modern infographic element design. The SVG format, in particular, is essential for web development, allowing for crisp, scalable graphics that load quickly and adapt to any screen size.
In Daily Creative Activities
Even personal projects are enhanced. A blogger might use elements to create a visual summary of a recipe's steps. A community group creating a newsletter can illustrate event statistics. The availability of these assets in multiple formats (like PNG for quick blog inserts or EPS for professional print layouts) empowers non-designers to produce polished, visually appealing content.
Exploring the Versatility of the Provided File Formats
Understanding the practical use of each file type in a typical template bundle is key to leveraging these tools effectively.
- AI & EPS: These are the native, editable vector files. They are the source code of the design. Using Adobe Illustrator or similar vector software, you can customize every aspect—change colors, resize individual components, combine elements, or extract a single icon. This is for deep customization and professional design work.
- SVG: Scalable Vector Graphics are the web-friendly vector format. They are perfect for embedding directly into websites, HTML emails, or digital presentations where scalability and interactivity (like CSS animation) might be needed.
- PNG: This raster format offers transparency support. It's ideal for digital projects where you need a ready-to-use, high-resolution graphic with a transparent background to overlay onto other digital content, such as social media posts, video edits, or PowerPoint slides.
- JPG: The universal raster format. JPG files are best suited for print-ready documents or situations where a standard, high-quality image file is required, and transparency is not necessary, such as placing graphics into certain word processors or basic desktop publishing tools.
This multi-format approach ensures the template is not just a static image but a flexible design system. You're equipped for print (brochures, posters), decoration (website backgrounds, wall art), element design (creating new graphics from the parts), and, of course, building full infographics.
Building a Broader Understanding: Elements as a Design Language
To truly grasp the value, it's helpful to think of a modern infographic element template not as a collection of pictures, but as a visual language. Each icon, chart type, and connector is a "word" or "phrase." When you master this language, you can compose visual "sentences" and "stories" for any purpose.
For example, a template might include:
- A set of data visualization elements: Pie chart segments, bar graph bars, line graph points. These aren't pre-filled charts; they are the styled components you arrange with your own data.
- Conceptual icons: Modern representations of ideas like "innovation" (a light bulb with a unique style), "growth" (an ascending arrow with a leaf), or "security" (a shield with a geometric pattern).
- Structural components: Banners for headings, dividers to separate sections, background patterns to add texture without distraction.
By combining these, a small business owner can create a visual mission statement. A fitness coach can illustrate a workout plan's progression. The elements provide the vocabulary; the user provides the narrative.
Clarifying Assumptions and Best Practices
A common assumption is that using templates makes everything look generic. This is only true if used without adaptation. The power lies in customization. With the vector source files, you can adjust colors to match your brand palette, modify shapes slightly, or mix elements from different sets to create a unique hybrid style.
Another key point is consistency. The hallmark of a professional visual piece is a consistent design language throughout. Using a unified set of elements ensures that all charts, icons, and decorations share the same line weight, color saturation, and stylistic feel, creating a polished and credible end product.
Finally, remember that good visual design supports the content, not replaces it. The elements should make the data or information clearer, not more decorative or confusing. Choose the right chart type for your data, use icons that truly represent the concepts, and maintain a hierarchy so the most important information stands out visually.
Conclusion: Empowering Clearer Communication
Modern infographic element design vectors represent a fundamental shift in how we share knowledge. They democratize good design, providing professionals and enthusiasts alike with the tools to communicate with visual authority. Whether the goal is to print an annual report, decorate a website, design an app interface, or simply create a more engaging presentation, these versatile templates serve as a bridge between raw information and human understanding.
By embracing these assets and understanding their formats and applications, you equip yourself to cut through the noise of the information age. You transform numbers into narratives, processes into pictures, and ideas into impactful visuals. In doing so, you not only convey information but also ensure it is seen, understood, and remembered—the ultimate goal of communication in our modern, data-driven world.