Chart Infographic Presentation Template: A Practical Guide for Smart Use
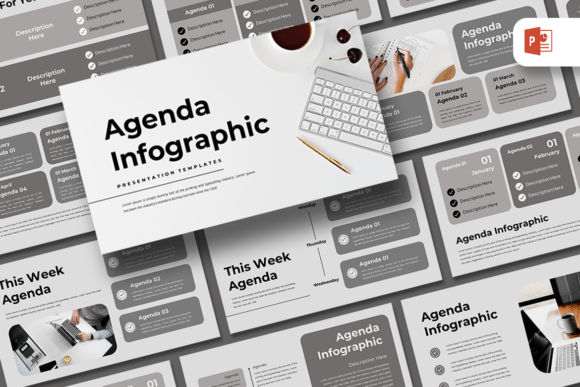
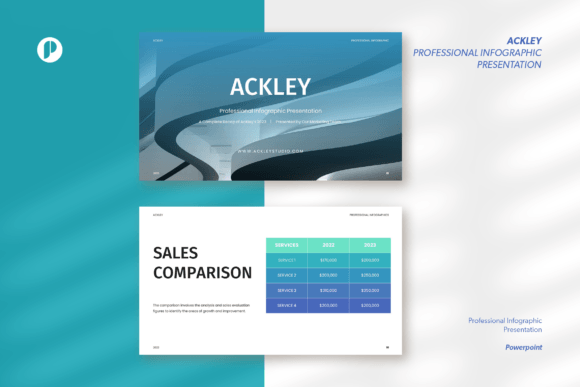
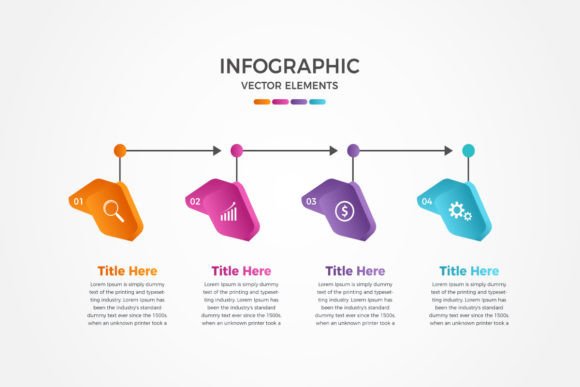
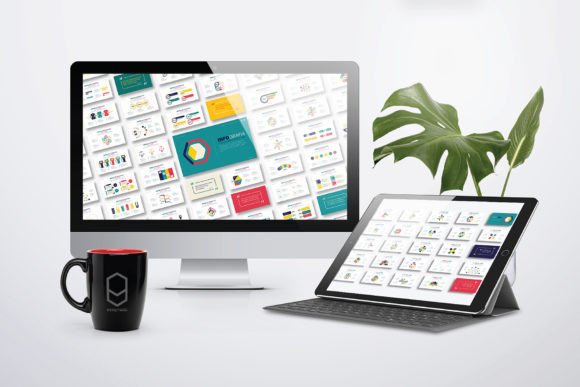
If you've ever stared at a blank PowerPoint slide, knowing you need to communicate complex data but unsure how to begin, you understand the value of a good template. A Chart Infographic Presentation Template is designed to solve that exact problem. It’s a pre-built framework, typically with 100 editable pages, crafted in a standard landscape aspect ratio like 16:9 (34x19 cm or 1920x1080 px), that provides you with a library of charts, graphs, and visual layouts. The promise is simple: instead of building every visual from scratch, you can drag, drop, and customize to create a professional presentation rapidly.
Why Templates Appeal—And Where Pitfalls Begin
Professionals, educators, and marketers are drawn to these templates for efficiency and consistency. The features like easy drag-and-drop to change pictures, fully resizable graphics, and the use of free fonts address common pain points. However, the initial excitement of downloading a file labeled “100 Editable Pages” can lead to overlooked details. The most common mistake is assuming that the template is a finished product rather than a starting tool. This misunderstanding can waste hours and lead to disappointing results.
Overlooking the “Editable” Reality
A key feature advertised is that all graphics are resizable and editable. In practice, this means you have the freedom to change colors, sizes, and text. But many beginners open the PowerPoint PPTX file and try to use it like a rigid theme, simply filling in text boxes without restructuring layouts to fit their specific data story. For example, using a complex multi-axis chart template for a simple single-data-point comparison creates visual confusion. The better approach is to see each page as a modular component. Ask yourself: “Does this layout serve my data, or am I forcing my data into this layout?” Start by auditing your content and then selecting the template slides that match your narrative flow, not the other way around.
The Critical Detail: Images Used in Demos Are NOT Included
This is a point often missed in the rush to download. The promotional visuals showing stunning, full-slide photographs are purely for demonstration. The template itself will not include those stock images. If you don’t plan for this, you’ll open the file and find placeholder boxes with instructions to “insert image here,” leading to a scramble for suitable royalty-free photos. This affects the quality and speed of your workflow. Before you even download a Chart Infographic Presentation Template, check your own image resources or budget for a stock photo subscription. Have a folder of relevant images ready so you can execute the easy drag-and-drop feature immediately.
Font Freedom and Compatibility Checks
The mention of “Free Font Used” is a helpful feature, ensuring you don’t need expensive font licenses. However, a subtle mistake is not verifying font compatibility across systems. If you edit the presentation on one computer and then present on another, font substitution can occur, subtly altering text alignment and spacing. Always embed the fonts in your final PowerPoint file (under Save options) or, as a precaution, use the template’s fonts but also ensure they are common system fallback fonts like Arial or Calibri for critical body text.
Navigating the 100-Page Library Without Overwhelm
Having 100 editable pages is fantastic, but it can be paralyzing. A common error is trying to use too many different chart styles in one presentation, creating a jarring, inconsistent visual experience for your audience. The template offers variety to cover many scenarios, but your single presentation should maintain a cohesive style. Practical advice: limit yourself. After opening the PPTX file, spend time browsing the master slides or the “Help Inside” section if provided. Identify a core set of 5-7 chart types (e.g., bar charts, pie charts, progress icons) that fit your data, and stick with those throughout your deck. Recolor them to a uniform palette to establish brand consistency.
The “easy and fully editable in PowerPoint” claim is true, but it relies on your basic PowerPoint proficiency. If you are unfamiliar with how to group objects, use the alignment tool, or edit chart data directly within PowerPoint’s native chart engine, you might struggle. This isn't a template flaw, but a user oversight. Before diving in, refresh your skills on these core PowerPoint functions. Many templates include dummy data; practice changing that data in a sample chart to ensure you understand the process. This small investment prevents frustration later.
The Aspect Ratio and Output Assurance
The landscape 16:9 aspect ratio is the modern standard for digital presentations and screens. A misunderstanding arises when users need to present in a different format, like a printed booklet or a vertical screen. They force the template into a different ratio, distorting all the carefully designed graphics. If your output medium is different, this template may not be suitable without significant redesign. Always confirm your presentation delivery method first. If you must use it for a non-landscape format, only use the most basic chart elements and rebuild the layouts on new slides, treating the template as a component library rather than a slide deck.
A Balanced Approach to Evaluation and Use
To avoid poor decisions, evaluate a Chart Infographic Presentation Template with a solution-focused mindset. Before committing, ask: Does it include a help file or instructions? (The “Help Inside” mention is a good sign, but check it.) Is the chart variety relevant to my industry? (A marketing funnel chart is useless for a scientific researcher.) Are the graphics truly vector-based and resizable without loss of quality? (Open a sample and test resizing a complex graphic to check for pixelation.)
Finally, remember the core purpose: communication. The best use of this tool is not to create the most colorful presentation, but the clearest one. Use the template’s structure to eliminate design guesswork, but apply your own critical eye to data hierarchy and simplicity. A well-edited template slide, where you’ve removed unnecessary decorative elements to highlight the key data point, will always outperform a slide where every template feature is used. Your goal is a professional, clear, and effective presentation—the template is your ally in that process, not the driver.
By approaching a Chart Infographic Presentation Template as a flexible toolkit, preparing your assets upfront, and focusing on cohesive storytelling, you turn a generic download into a powerful, custom communication asset. It saves time not by doing the work for you, but by providing the foundation upon which your expertise can build a compelling visual narrative.