The Power and Purpose of Infographic Labels
In a world overflowing with information, clarity is currency. We seek not just data, but understanding. This is where visual communication shines, and a crucial, often overlooked element within it is the infographic label. Far more than just a name tag for a chart, these labels are the silent narrators of your visual story, guiding the viewer from confusion to comprehension. Let's explore what they are, why they matter, and how they fit into our daily quest for better understanding.
What Exactly is an Infographic Label Element?
Imagine an infographic as a detailed map of a complex idea. The colors, shapes, and icons form the landscape—the mountains, rivers, and cities. The infographic label element is the signpost on that map. It is the textual component that directly annotates, identifies, or explains a specific part of the visual. This could be the title of a bar in a graph, the name of a step in a process flowchart, the statistic placed beside an icon, or the caption for an illustrative image within the graphic.
Its purpose is singular yet vital: to bridge the gap between visual symbolism and concrete meaning. Without a clear label, a beautifully designed icon representing "global connectivity" might be misinterpreted as merely a "web network." The label anchors the abstract visual in a concrete fact or concept.
The Anatomy of a Good Label
Effective infographic labels aren't just any text thrown onto a design. They follow key principles:
- Clarity and Brevity: They use the simplest, most direct language possible. "Annual Growth: 15%" is preferable to "The figure representing the year-over-year increase is fifteen percent."
- Strategic Placement: They are positioned to be instantly associated with their corresponding visual element, without cluttering or obscuring it.
- Consistency: Font style, size, and color across labels create a cohesive reading experience and reinforce the infographic's structure.
- Hierarchy: Primary labels (like main section titles) might be bold or larger, while secondary labels (like data points) are subtler, guiding the viewer's attention flow.
The Significance of Labels: From Decoration to Understanding
The common assumption is that infographics are primarily about "looking good." While aesthetics are important, their core value is in cognitive efficiency. A well-labeled infographic reduces the mental effort required to decode information. This significance permeates many aspects of modern life.
In business and work, labeled infographics are indispensable. They turn dense quarterly reports into digestible performance snapshots, explain complex workflows to new employees, and present market research findings to stakeholders in a persuasive, clear manner. A sales chart with clear labels for each product line instantly communicates successes and challenges, driving faster, data-informed decisions.
In education and learning, they are powerful pedagogical tools. A timeline of historical events with labeled dates and key figures helps students visualize sequences. A labeled diagram of a biological process, like photosynthesis, makes abstract scientific concepts tangible. Labels here act as memory anchors, linking the visual image to the factual knowledge.
In our daily activities and technology, we encounter them constantly. A public health poster explaining vaccination steps uses labels to clarify each phase. A user interface (UI) dashboard for a fitness app uses labels on graphs to show your weekly activity—"Steps," "Active Minutes," "Calories Burned." These labels integrate information seamlessly into our routines, enhancing usability and personal insight.
Clarifying a Common Misunderstanding
One prevalent misconception is that labels are optional if the visual is "self-explanatory." This is rarely true. Visuals can suggest, but labels confirm. A pie chart segment might look largest, but a label stating "35% - Marketing Budget" provides the exact, unambiguous truth. Omitting labels risks leaving interpretation open to the viewer's assumptions, which can lead to misunderstanding the core message you intend to convey.
The Practical Relevance: Building Your Own Visual Stories
Understanding infographic labels empowers you to create more effective communications, whether for a professional project, a classroom assignment, or a personal blog. It shifts your focus from merely selecting icons to crafting a complete explanatory unit. Here’s how you can apply this knowledge practically.
Start by defining the key information points your graphic must convey. For each point, ask: "What visual element will represent this?" and then immediately, "What short, precise text will explain it?" This tandem thinking ensures your design is purposeful from the start.
Examples in Action
Consider an infographic about "Home Energy Savings."
- A large icon of a house is your central visual. The label might be: "Key Areas for Efficiency"—this sets the topic.
- Smaller icons of a thermostat, light bulb, and window are placed around it. Their respective labels: "Programmable Thermostat," "LED Lighting," "Insulated Windows"—these identify the specific methods.
- Next to each method icon, a small data point is added with a label: "Save up to 10% on heating," "Use 75% less energy," "Reduce heat loss by 25%"—these provide the compelling facts that motivate action.
This layered, labeled structure guides the reader logically from the general concept to specific solutions and their proven benefits.
Tools and Resources: Having Fun While You Learn
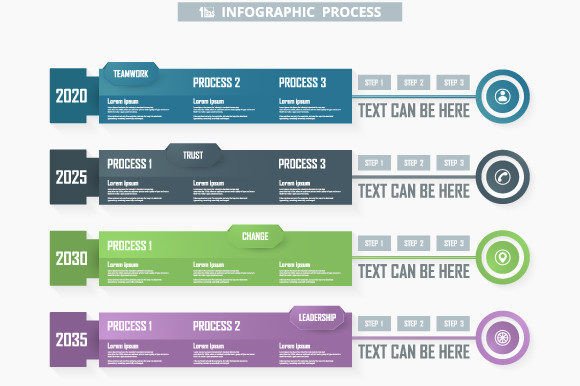
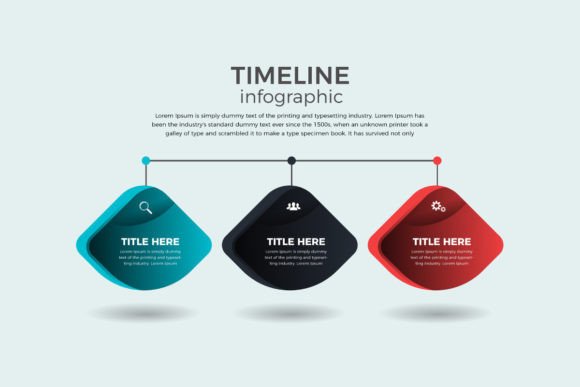
Fortunately, creating professional-looking, well-labeled infographics doesn't require being a master graphic designer. Many resources exist to help you. For instance, a set of infographic label elements—pre-designed SVG and EPS10 files—can be a fantastic starting point. These are scalable, high-quality graphic assets.
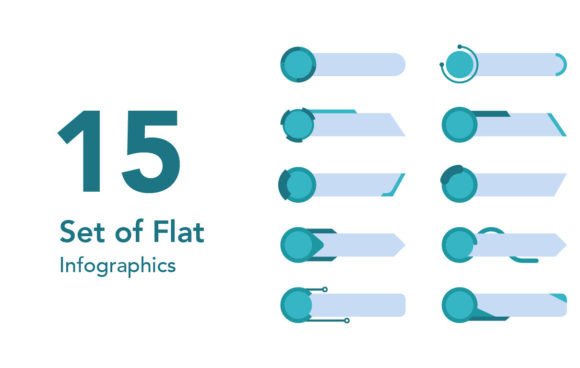
Imagine you receive a package containing 15 different infographic label elements, along with SVG files (perfect for web use and modern design software) and EPS10 files (ideal for print and scalable vector editing). These might include stylish callout boxes, sleek data badges, minimalist pointers, and elegant title banners. With such a toolkit, you can focus on your content and message, simply placing and customizing these label formats to suit your needs. It demystifies the design process and, indeed, lets you have fun while building something informative and impactful.
Using such elements, you can rapidly prototype an infographic. You drag in a "statistic bubble" SVG, type in your key number and a brief label, position it over a relevant chart segment, and your point is made clear and attractive. This practical approach makes infographic creation accessible, aligning with the broader trend of democratizing design tools for better communication.
Building a Broader Understanding
Ultimately, mastering the infographic label element is about embracing a holistic view of communication. It recognizes that text and image are not rivals but partners. In our information-rich era, the ability to synthesize these forms—to label your visuals with precision—is a key skill.
It enhances not just the infographic itself, but also the viewer's experience. It reduces friction, builds trust through clarity, and ensures your valuable insights are received as intended. Whether you're analyzing a labeled infographic in a news article or creating one for your next project, you are participating in a more efficient, more human way of sharing knowledge. And that is a purpose worth labeling clearly.